JavaScript Quickstart
Hamoni Sync provides SDK for JavaScript developers to integrate it into their web, mobile or desktop apps running on JavaScript. You can get this through npm or adding a script tag to your source file.
In this guide you'll see how Hamoni Sync can be used to build a realtime dashboard. Key takeaway will be how to create, manipulate and get state change update from Hamoni Sync. This basic will guide you in using Hamoni Sync for any application of your choosing. Below is a preview of the working app:
Get the source code
Clone or download the completed sample app from GitHub. Navigate to the downloaded source code directory/folder. Run npm install to install the modules needed to run the application. This includes Hamoni Sync npm package.
Setup application
Open the file server.js
On line 2 you'll see a declaration that imports Hamoni Sync npm package
let Hamoni = require("hamoni-sync");
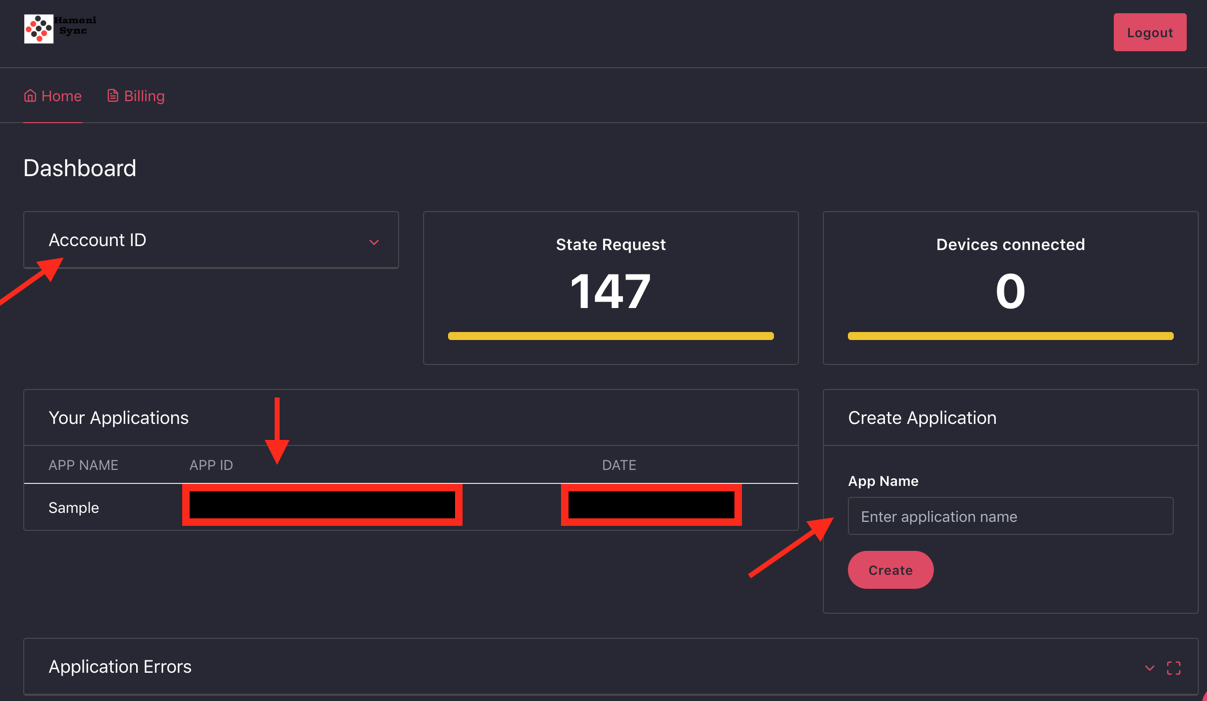
To use it, you need to initialise it using a token. You'll need your account and application ID which you can find on your dashboard, to generate a token. Go to dashboard.hamoni.tech (you'll need to register and login if you don't already have an account). Create a new application or copy the application ID of an existing application.
Use this information to call Sync token server in order to get a token.
const accountId = "YOUR_ACCOUNT_ID";
const appId = "YOUR_APP_ID";
const response = await fetch("https://api.sync.hamoni.tech/v1/token", {
  method: "POST",
  headers: {
    "Content-Type": "application/json; charset=utf-8"
  },
  body: JSON.stringify({ accountId, appId })
});
const token = await response.json();

let hamoni = new Hamoni(token);
We recommend calling the Sync token server from your backend and sending the response token to the client application.
Connect the client
After initialisation, you can connect to the server by calling connect() function.
hamoni
  .connect()
  .then( () => {
    createAreaChart();
    createBarChart();
    createMessageCount();
    createPieChart();
  })
  .catch(error => console.log(error));
The connect() function returns a promise. It resolves if it is able to connect the client to the server.
Create state
When succesfully connected, you can create state that relates to your application. On lines 37 - 40, four functions are called to create state which will be used to display realtime data in the sample dashboard:
hamoni
  .connect()
  .then( () => {
    createAreaChart();
    createBarChart();
    createMessageCount();
    createPieChart();
  })
  .catch(error => console.log(error));
Hamoni Sync distinguishes between the type of state you can have through what is called Sync Primitives. There are three types:
- Value: This kind of state holds simple information represented with datatypes like string, boolean or numbers. It is best suited for cases such as unread message count, toggles, etc.
- Object: Object state represents states that can be modelled in a single JSON object. An example usage could be storing the score of a game or score of a live match.
- List: This holds a list of state Object. This can be used for real-time data table, charts, and data visualisation.
The sample dashboard uses value and list state primitive types.
Create new message count state
createMessageCount() is defined on line 49
function createMessageCount() {
  hamoni
    .createValue("dashboard-messages", 20)
    .then(state => {
      console.log("create message count success");
      updateMessageCount(state);
    })
    .catch(error => console.log(error));
}
This creates a value state used to count the number of new messages displayed in the dashboard. The value "dashboard-message" is the name we give to this state. It is passed alongside the value for that state to the createValue() function. State name is across application. If successful, it resolves returning an object of the state primitive which can be used to manipulate that state.
Create chart states
The sample dashboard will show realtime chart rendered using ChartJS in the browser. Below the function definition for createMessageCount() you'll find three other functions, namely, createPieChart(), createAreaChart() , and createBarChart(). Lets look at createBarChart() function on line 90:
function createBarChart() {
  hamoni
    .createList("myBarChart", [
      { label: "January", data: 300 },
      { label: "Feburary", data: 200 },
      { label: "March", data: 500 },
      { label: "April", data: 700 },
      { label: "May", data: 300 },
      { label: "June", data: 900 }
    ])
    .then(barChart => {
      console.log("create success");
      updateBarChart(barChart);
    })
    .catch(error => console.log(error));
}
This creates a list state for the bar chart. It takes as parameters the name of the state and its value. If successful, it resolves returning an object of that state primitive which can be used to manipulate that state.
Get state and display charts on the dashboard
The setup until now allows the server code to create state. In this section you'll see how to get state, display chart based on the state, and re-render the chart if there's a state change.
In the folder public/js, open the file sb-admin-charts.js. Replace the placeholder for account and application ID with your account ID and application ID retrieved from the Sync dashboard.
const accountId = "YOUR_ACCOUNT_ID";
const appId = "YOUR_APP_ID";
let token = await fetch("https://api.sync.hamoni.tech/v1/token", {
  method: "POST",
  headers: {
    "Content-Type": "application/json; charset=utf-8"
  },
  body: JSON.stringify({ accountId, appId })
})

let hamoni = new Hamoni(token);
Lines 88 to 212 defines 3 functions which uses data from the state to make charts. Below is the function definition for makePieChart()
 function makePieChart(state) {
  var ctx = document.getElementById("myPieChart");
  var myPieChart = new Chart(ctx, {
    type: "pie",
    data: {
      labels: state.map(element => element.label),
      datasets: [
        {
          data: state.map(element => element.data),
          backgroundColor: state.map(element => element.backgroundColor)
        }
      ]
    }
  });
  return ctx;
}
It takes the retrieved state from the Sync server to draw a pie chart. This sample uses ChartJS for the charts (visit www.chartjs.org/docs/latest to learn more).
The data field tells ChartJS about the data needed to generate a chart. The pie chart uses a list primitive which when retrieved, returns an array. The other functions (makeBarChart() & makeAreaChart() ) uses state from Hamoni Sync in a similar way.
With these functions in place, you need to retrieve the state from Sync and subscribe for state changes. Lines 15 to 75 gets the data for each state and calls the respective function to render chart. Below is the code from lines 36 to 55 for rendering a bar chart.
// -- Bar Chart Example
hamoni
  .get("myBarChart")
  .then(myBarChart => {
    console.log("get success");
    var state = myBarChart.getAll();
    makeBarChart(state);

    myBarChart.onItemAdded(value => {
      var state = myBarChart.getAll();
      makeBarChart(state);
    });
    myBarChart.onItemUpdated(value => {
      var state = myBarChart.getAll();
      makeBarChart(state);
    });
  })
  .catch(error => console.log(error));
It retrieves the state called myBarChart. If successful it calls getAll() on the object that gets returned from the promise. This gives me all the state data which is then passed to makeBarChart(state) function.
Get real-time state updates
To get state changes, you pass a callback function to onUpdated() for value and object primitive, or onItemAdded() and onItemUpdated() for list primitive. This callback will get the new state as input parameter when it's called. The code in sb-admin-chart.js subscribes to state update for each chart rendered. The code shown in previous section calls makeBarChart() when there's an update.
To get and display new message count for the state dashboard-messages, _the code in public/js/index.js handles this purpose. _
Update state
Clients receives state updates when the state changes. In this sample application the change is effected from the server code in server.js located in the root directory. The functions updateMessageCount(), updateAreaChart(), and updateBarChart() updates the state at certain time intervals. The syntax to update state differs based on the sync primitive type. See the Usage section for more details.
Run the app
To run the app, run npm start This should start the server on port 5000. It will create the state with the default values specified in server.js. Open localhost:5000 in your preferred browser and see how the state updates in realtime
More sample code
For more sample code checkout our GitHub page.